Abstract
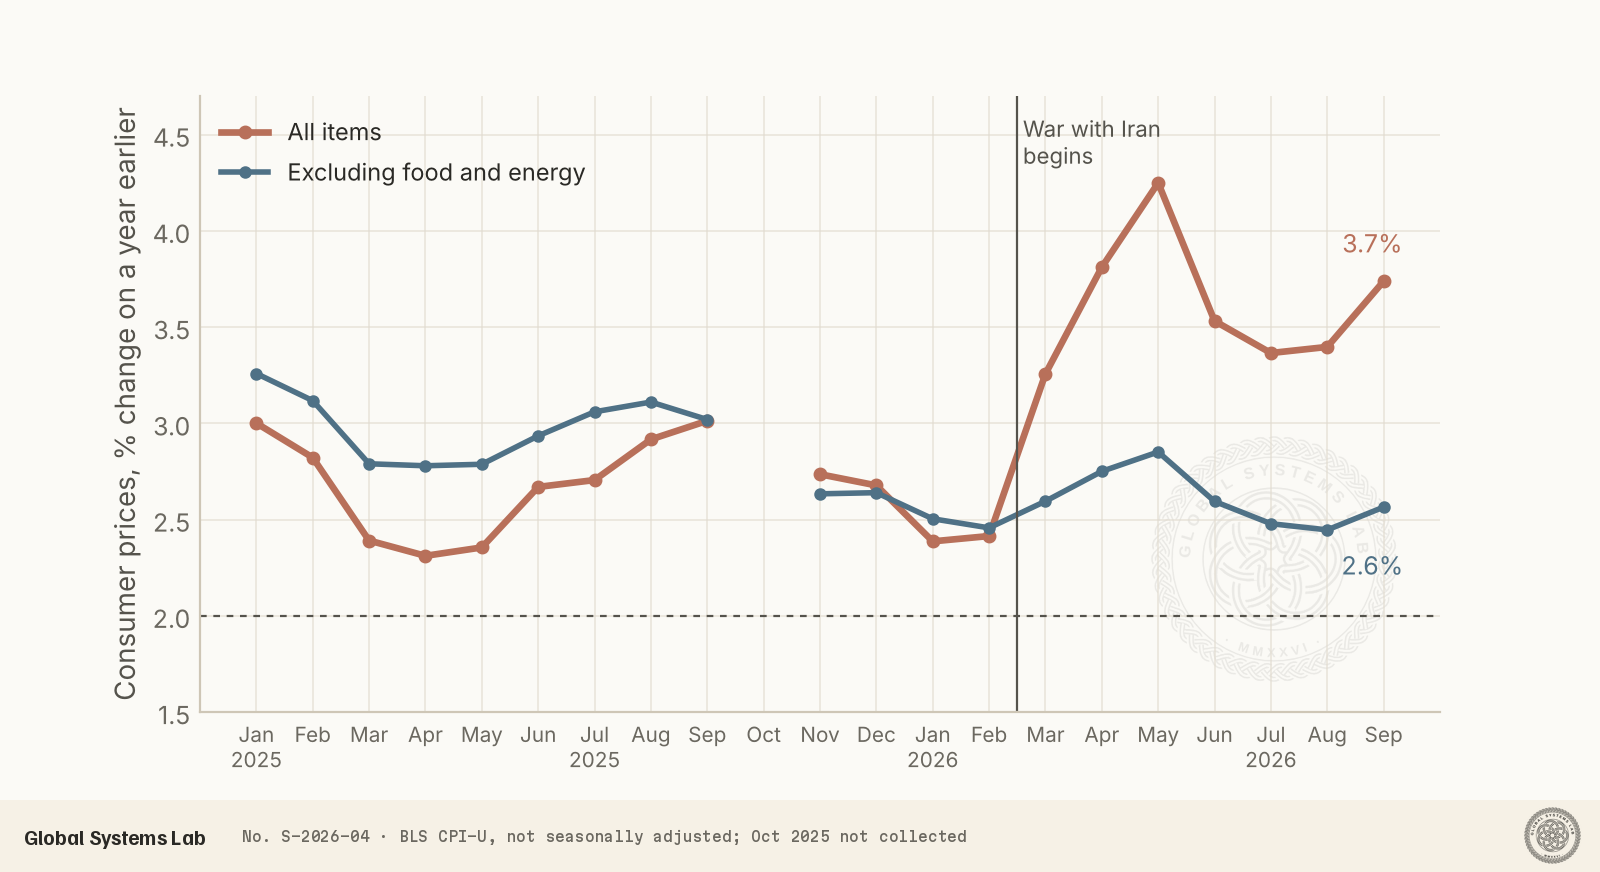
This special report reviews the state of the US economy in autumn 2026, the companion to our report on Europe. It uses official data from the Bureau of Economic Analysis (BEA), the Bureau of Labor Statistics (BLS), the Federal Reserve and the International Monetary Fund (IMF). The US has weathered the energy shock from the war with Iran far better than Europe in terms of output. Real GDP grew at an annual rate of 3.4% in the third quarter, led by business investment and consumer spending. The price of that strength is inflation. Consumer prices rose 3.7% in the year to September, driven by gasoline prices up 34%. Core inflation is lower, at 2.6% on the CPI, but the Fed’s preferred core PCE measure is 3.1%. The labour market has cooled sharply: payrolls grew by only 29,000 in September, and job growth has averaged well under 100,000 a month since spring, though unemployment remains low at 4.2%. The Fed raised rates in September for the first time since 2023 and held in October, with markets expecting a further rise in December. Official forecasts see growth of about 2.3% this year and next, with inflation not back to 2% until 2029.
Key findings
- Real GDP grew at a 3.4% annual rate in Q3 2026 (0.8% on the quarter), up from 2.2% in Q2, with investment, consumer spending and government spending all rising. Private domestic demand grew 4.9%.
- CPI inflation was 3.7% in September, down from a peak of 4.2% in May but up from 2.4% before the war began. Energy prices were up 20.4% and gasoline 34.2%; core CPI was 2.6%.
- Hiring has slowed: payrolls rose 29,000 in September, July was revised to a loss, and unemployment ticked up to 4.2%. Real hourly earnings fell 0.5% in September.
- The Fed raised its target range to 3.75–4.00% in September and held in October by a 10–2 vote, with two members preferring another rise. Its September projections see core PCE inflation of 3.4% this year and a return to 2% only by 2029.
- US output grew 0.8% in the third quarter at a quarterly rate, twice the euro area’s 0.4%, largely because it is a net energy exporter while Europe imports most of its gas.
Introduction
This report is the companion to our special on Europe’s economy. Both regions have faced the same shock: the war between the United States and Iran, which began in February 2026, has disrupted oil and gas shipping through the Strait of Hormuz and sent energy prices sharply higher. But the two economies have responded very differently. Europe, which imports most of its energy, is growing slowly. The United States, now a large exporter of oil and gas, is growing quickly, but faces an inflation problem of its own and a labour market that has lost much of its momentum.
Here we ask the same questions as for Europe. How fast is the US economy growing, and why? How high is inflation, and how is the Federal Reserve responding? What is happening to jobs and household incomes? And what do official forecasters expect? We use only official statistics and published forecasts.
Growth: faster than expected
The US economy is growing strongly. Real GDP rose at a seasonally adjusted annual rate of 3.4% in the third quarter of 2026, according to the BEA’s advance estimate of 29 October, up from 2.2% in the second quarter and 2.5% in the first. At a quarterly rate, which is how Europe reports growth, that is 0.8%, twice the euro area’s 0.4%.
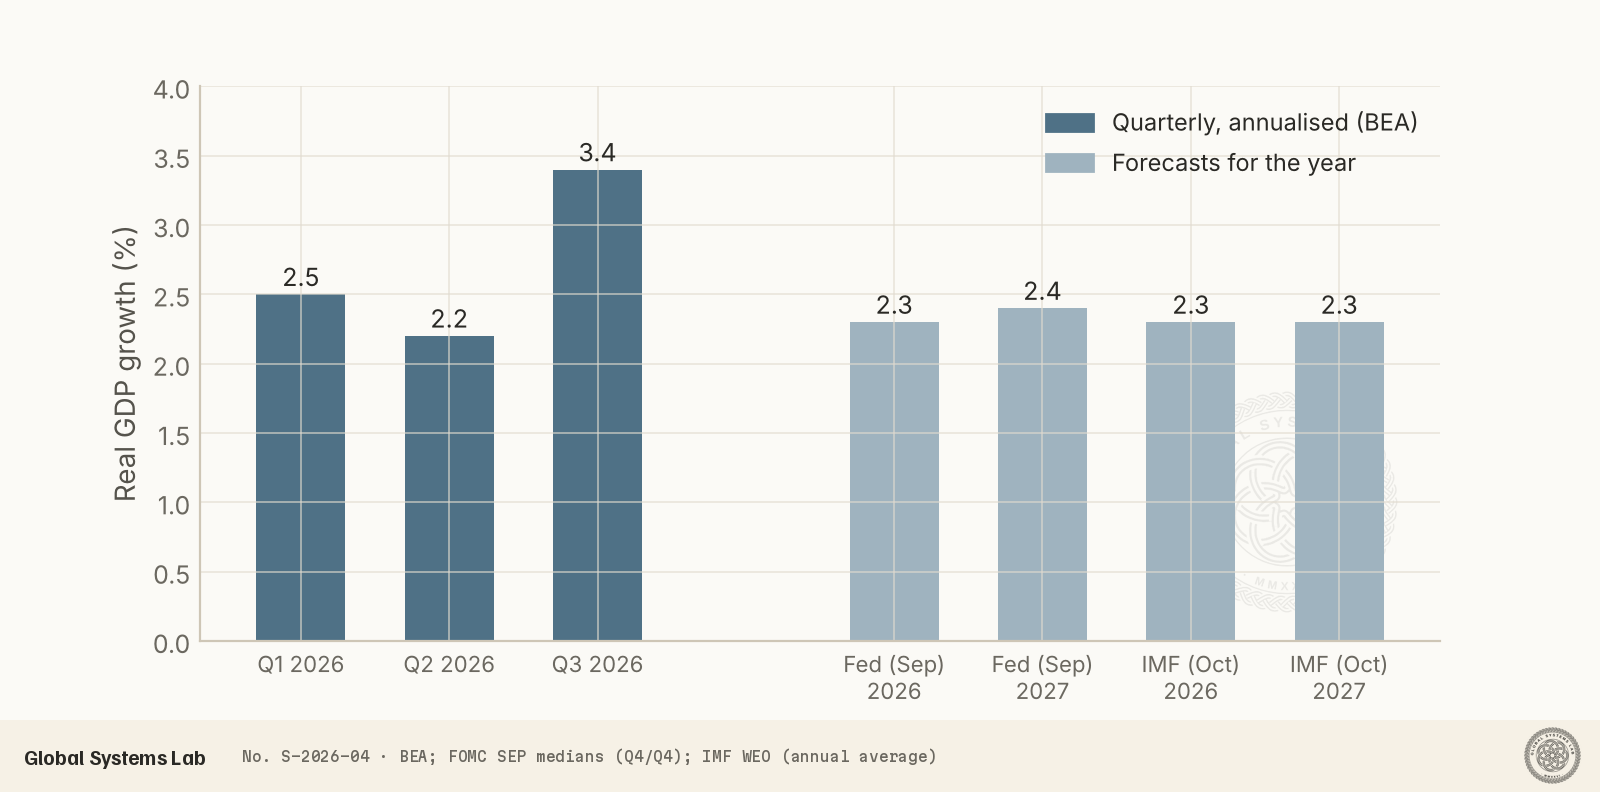
The growth was broad. Investment, consumer spending and government spending all increased, partly offset by a fall in exports, led by petroleum products. Within investment, equipment led the gains, especially computers and information-processing equipment, the kind of spending linked to the build-out of artificial intelligence. A useful gauge of underlying demand, real final sales to private domestic purchasers, which combines consumer spending and private fixed investment, rose 4.9%, up from 4.6%. The Fed’s own statement in October described activity as expanding at a “strong” pace, upgraded from “solid” in September.
Two features of the data deserve caution. Government spending was flattered by lower sales from the Strategic Petroleum Reserve, which are counted as negative spending. And this is an advance estimate, built on incomplete data. The second-quarter figure was revised up from 1.5% to 2.2%, a reminder that early estimates can move substantially.
Inflation: the energy shock at the pump
Inflation is the clearest cost of the war. Consumer prices were 2.4% higher than a year earlier in February 2026. After the war began, energy prices drove inflation up quickly, to 3.8% in April and a peak of 4.2% in May. It eased over the summer as oil prices fell back, then rose again: in the year to September the CPI was up 3.7%, compared with 3.4% in August.
The breakdown shows where the pressure is. In September energy prices were up 20.4% on the year and gasoline 34.2%; gasoline alone accounted for more than half of the month’s 0.6% rise in prices. Food prices were up 2.5% and shelter 3.2%. Excluding food and energy, core CPI inflation was 2.6%, and it has stayed in a range of about 2.4% to 2.9% throughout the shock. In other words, the inflation surge has so far been an energy surge rather than a broad one.
The Federal Reserve’s preferred measures tell a slightly less comfortable story. The personal consumption expenditures (PCE) price index was up 3.6% on the year in September, and core PCE, which excludes food and energy, was up 3.1%. Core PCE was already well above target before the war, at 2.7% in October 2025, and peaked at 3.5% in May.
Jobs: hiring has stalled
The labour market is where the picture has darkened most. Employers added only 29,000 jobs in September, far fewer than the 84,000 to 90,000 economists expected. Revisions cut another 60,000 jobs from July and August, leaving July with a small loss. Hiring has been weak and erratic all year: the economy lost jobs in February, added more than 200,000 in March, then slowed sharply from late spring.
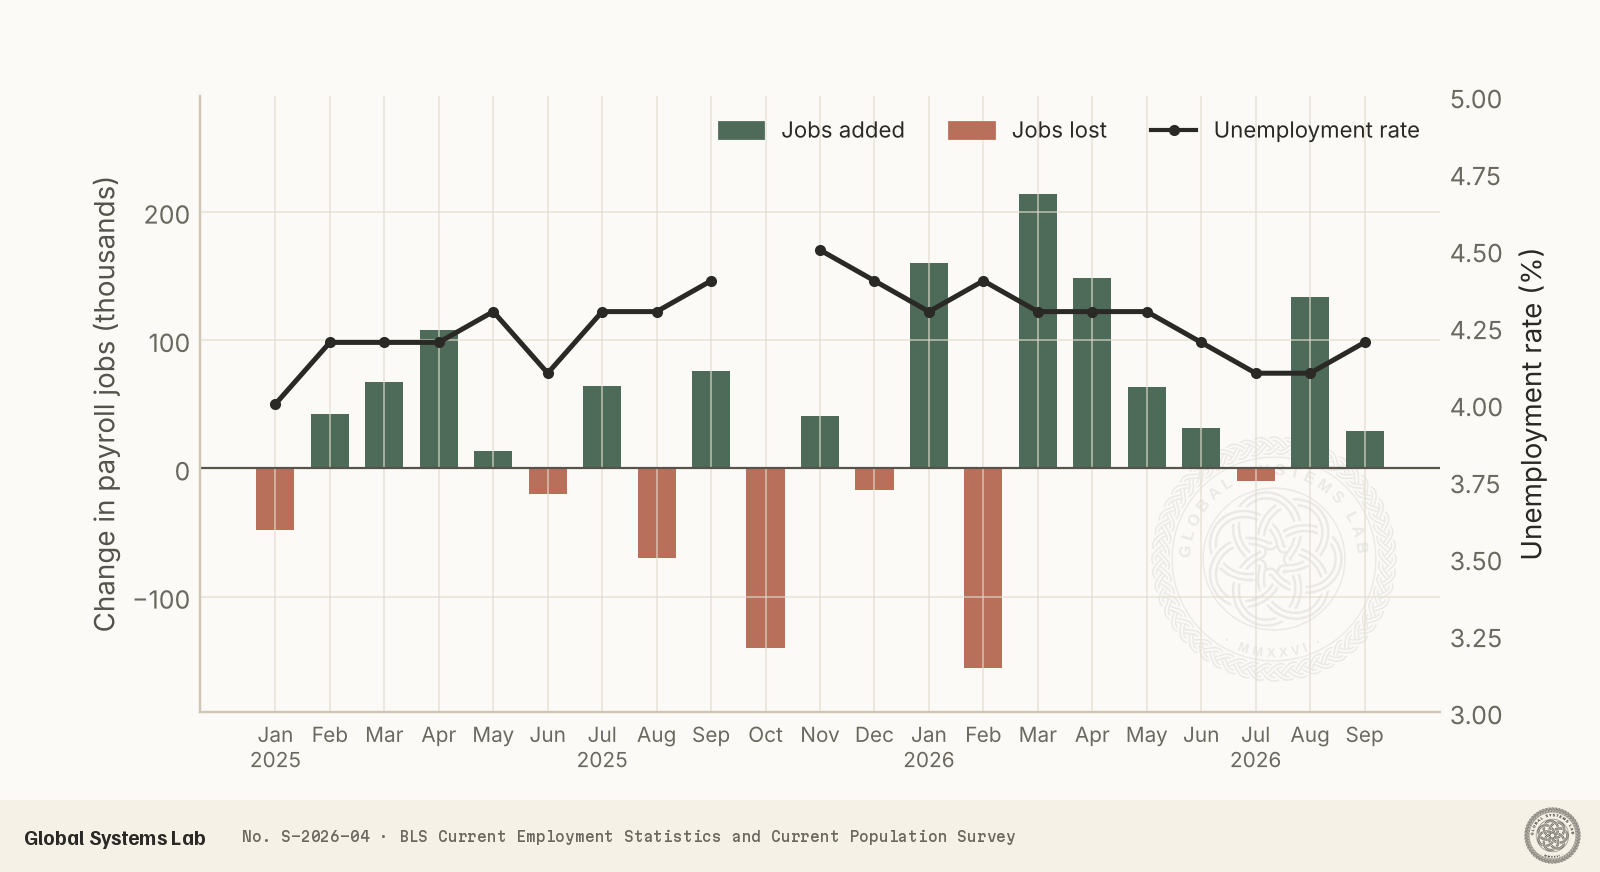
Yet unemployment has stayed low. The rate rose to 4.2% in September from 4.1%, but it has moved only between 4.1% and 4.5% over the past year and is lower than a year ago. Part of the explanation is slower growth in the labour force, which means fewer new jobs are needed each month to keep unemployment steady. The Fed’s statement says job gains have “kept pace with the workforce.” Labour force participation was 61.8% in September.
For workers, the squeeze is in pay. Average hourly earnings rose to $37.81 in September, roughly 3% up on a year earlier, which is less than inflation. Real average hourly earnings fell 0.5% in September alone. Households are spending, but their purchasing power is being eroded by fuel costs.
The Fed: raising rates again
The Federal Reserve cut interest rates through 2025. This autumn it reversed course. On 16 September the Federal Open Market Committee (FOMC) unanimously raised its target range for the federal funds rate by a quarter point, to 3.75–4.00%, its first rise since 2023, citing inflation above its 2% objective. Chair Kevin Warsh said the Committee’s “predominant focus” was on the price-stability side of its mandate.
On 28 October the Committee held rates steady by a 10–2 vote. Cleveland Fed President Beth Hammack and Governor Lisa Cook dissented, preferring another quarter-point rise. The statement said inflation remains elevated and that “the accumulation of more information” would guide the next step. Futures markets put the chance of a rise at the December meeting at around 80%.
The September projections show what Committee members expect. The median participant sees GDP growth of 2.3% in 2026 and 2.4% in 2027, unemployment steady at 4.1%, PCE inflation of 3.7% at the end of 2026 falling to 2.3% in 2027, and core PCE of 3.4% this year. Inflation is not projected to return to the 2% target until 2029. The median projection for the federal funds rate at the end of 2026 is 4.1%, consistent with one more quarter-point rise this year.
What the forecasters expect
The official forecasts agree on solid growth. The IMF’s October World Economic Outlook projects US growth of 2.3% in both 2026 and 2027, above the 2.1% it expects for advanced economies as a whole and well ahead of 1.1% for the euro area this year. The Fed’s projections are similar. Both see inflation staying above target through 2027, and both see the energy shock as the main reason.
Why the US and Europe have diverged
The contrast with Europe comes down mostly to energy. The United States produces more oil and gas than it consumes, so higher prices transfer income to American producers even as they hurt American consumers. Europe imports most of its energy, so higher prices drain income abroad. US natural gas prices are also set mainly by domestic supply, insulating American industry from the LNG shortage that has tripled European gas prices. The US also has a stronger investment boom, centred on AI and data infrastructure.
The similarities matter too. Both regions have seen headline inflation nearly double since February, the ECB has raised rates twice this year and the Fed once, and in both the shock has so far stayed in energy prices without spreading through wages. Both forecasts depend on energy prices falling back in 2027.
Risks
- Energy. A wider conflict in the Gulf would raise oil prices further. Gasoline is the most visible price in the economy, and higher fuel costs feed quickly into inflation expectations.
- The labour market. Hiring is near stall speed. If businesses start cutting jobs rather than simply hiring less, unemployment could rise quickly and consumer spending would weaken.
- Policy tightening. The Fed has signalled it will act if inflation persists. Higher rates for longer would weigh on housing and on the investment that is now driving growth.
- An AI investment reversal. The IMF lists a correction in the AI boom among the main risks to the global outlook. Equipment investment has been a major source of US growth.
- Upside. A ceasefire that reopened shipping through Hormuz would likely bring fuel prices down quickly and ease pressure on both inflation and household budgets.
Uncertainty and limitations
Advance GDP estimates and monthly payroll figures are routinely revised, sometimes substantially, as this year’s second-quarter GDP revision showed. October 2025 data for the CPI and household survey were not collected because of the federal government shutdown, leaving a gap in the series. Forecasts are conditional on assumptions about energy prices that could change quickly.
Conclusions
The US economy has absorbed the energy shock of 2026 with remarkable strength in output: growth of 3.4% in the third quarter, strong investment, and unemployment still near 4%. But it has paid in inflation, which is running near 3.7% and well above the Fed’s target, and in a labour market where hiring has slowed to a crawl and real wages are falling. The Fed has chosen to lean against inflation, and another rise in December looks likely. The next few weeks bring important tests: the October jobs report on 6 November, the October CPI in mid-November, the second estimate of third-quarter GDP and October PCE inflation on 25 November, and the Fed’s December decision.
References
- U.S. Bureau of Economic Analysis (2026). GDP (Advance Estimate), 3rd Quarter 2026, 29 October 2026. https://www.bea.gov/news/2026/gdp-advance-estimate-3rd-quarter-2026
- U.S. Bureau of Economic Analysis (2026). Personal Income and Outlays, September 2026, 29 October 2026. https://bea.gov/news/2026/personal-income-and-outlays-september-2026
- U.S. Bureau of Economic Analysis (2026). GDP (Third Estimate), 2nd Quarter 2026, 30 September 2026. https://www.bea.gov/news/2026/gdp-third-estimate-industries-corporate-profits-state-gdp-and-state-personal-income-2nd
- U.S. Bureau of Labor Statistics (2026). Consumer Price Index, September 2026 (USDL-26-1574), 14 October 2026. https://www.bls.gov/news.release/archives/cpi_10142026.htm
- U.S. Bureau of Labor Statistics (2026). The Employment Situation, September 2026, 2 October 2026. https://www.bls.gov/news.release/empsit.nr0.htm
- U.S. Bureau of Labor Statistics. Public Data API: series CUUR0000SA0, CUUR0000SA0L1E, LNS14000000, CES0000000001. Accessed 2 November 2026. https://www.bls.gov/developers/
- Board of Governors of the Federal Reserve System (2026). FOMC statement, 28 October 2026; Chair’s press conference transcript, 28 October 2026. https://www.federalreserve.gov/mediacenter/files/FOMCpresconf20261028.pdf
- Board of Governors of the Federal Reserve System (2026). Summary of Economic Projections, 16 September 2026. https://www.federalreserve.gov/monetarypolicy/fomcprojtabl20260916.htm
- Federal Reserve Bank of St. Louis (2026). FOMC Summary of Economic Projections, September 2026. FRED Blog. https://fred.stlouisfed.org/blog/2026/09/fomc-summary-of-economic-projections-september-2026
- International Monetary Fund (2026). World Economic Outlook: Resilience under Strain, Urgent Choices. October 2026. https://www.imf.org/en/Publications/WEO/Issues/2026/10/13/world-economic-outlook-october-2026
- TD Economics (2026). U.S. FOMC Meeting, October 27–28, 2026. https://economics.td.com/us-fomc-statement
Data availability
Monthly CPI inflation (headline and core), the unemployment rate and payroll changes from January 2025 to September 2026 are available below as a CSV file, computed from the BLS public data API on 2 November 2026. October 2025 data were not collected during the federal government shutdown. All figures are subject to revision: the October jobs report is due on 6 November and the second estimate of third-quarter GDP on 25 November.
Cite this
Global Systems Lab (2026). America's economy in an energy shock: strong growth, stubborn inflation, slower hiring. Global Systems Lab Transmission S-2026-04. https://globalsystemslab.com/transmission/us-economy-autumn-2026
BibTeX
@techreport{lab2026us,
  author = {Global Systems Lab},
  title = {America's economy in an energy shock: strong growth, stubborn inflation, slower hiring},
  institution = {Global Systems Lab},
  number = {S-2026-04},
  year = {2026},
  month = {nov},
  url = {https://globalsystemslab.com/transmission/us-economy-autumn-2026}
}