Abstract
We ran the lab’s Earth System Simulator through the six standard emissions scenarios used by the Intergovernmental Panel on Climate Change (IPCC), from the very low SSP1-1.9 to the very high SSP5-8.5, using its default, observation-constrained ensemble of several thousand plausible climates. By 2081–2100 the median warming above 1850–1900 ranges from 1.3 °C in the very low scenario to 4.4 °C in the very high one, closely matching the IPCC’s Sixth Assessment Report. In every scenario except the very low one, the 20-year average temperature passes 1.5 °C between 2028 and 2033; under the intermediate scenario, which sits near the path implied by today’s policies, it passes 2 °C in the early 2050s and reaches 2.6 °C (very likely 2.0–3.5 °C) by the end of the century. Carbon dioxide dominates the warming, while the cooling effect of air pollution is fading. The single largest source of uncertainty after the emissions choice itself is how sensitive the climate is to carbon dioxide, which spreads end-of-century outcomes in any one scenario across about 1.5 °C.
Key findings
- Warming in 2081–2100 ranges from 1.3 °C (very low emissions, SSP1-1.9) to 4.4 °C (very high, SSP5-8.5) above 1850–1900. The choice of emissions path matters more than any other factor.
- The simulator’s ranges agree with the IPCC Sixth Assessment to within 0.1 °C for every scenario’s median.
- In five of six scenarios the 20-year average passes 1.5 °C between 2028 and 2033. Only the very low scenario holds the peak near 1.5 °C, briefly, before temperatures fall back.
- Under the intermediate scenario, close to current policies, 2 °C is passed around 2053 and warming reaches 2.6 °C (very likely 2.0–3.5 °C) by 2081–2100, still rising.
- Carbon dioxide accounts for about 1.0 °C of the warming so far and about 2.2 °C of the 2100 total in the intermediate scenario; the masking effect of aerosols halves as air quality improves.
Introduction
Global temperatures have now spent three years at or near 1.5 °C above their pre-industrial level. The World Meteorological Organization (WMO) put 2024 at about 1.55 °C, the warmest year on record, and 2025 at about 1.44 °C, among the three warmest. The eleven years from 2015 to 2025 are the eleven warmest measured. With a strong El Niño under way since June 2026, this year is on course to be among the two warmest, and next year could set a new record.
Single years are noisy, though. What matters for the long run is the trend underneath, and where it goes next. This report asks three plain questions. How much warmer will the world be by the end of the century? When will it pass the thresholds people talk about, 1.5 °C and 2 °C? And how much of the answer is still in our hands?
To answer them we used the lab’s own Earth System Simulator, the same tool anyone can open in a browser, and ran it through the standard set of future scenarios that the climate research community shares.
Data and approach
The Earth System Simulator is a fast climate model. It does not simulate weather, clouds or oceans grid box by grid box, as the large models run on supercomputers do. Instead it tracks the planet’s energy budget as a whole: how much extra heat greenhouse gases trap, how much air pollution reflects away, and how quickly the land and oceans warm in response. Because it runs in seconds, it can be run thousands of times, each with a slightly different but plausible version of how the climate behaves. Those versions are weighted by how well they reproduce the warming that has actually been observed, so the spread of results is a fair picture of what we do and do not know.
The futures come from the Shared Socioeconomic Pathways (SSPs), the scenarios used in the IPCC’s Sixth Assessment Report. Each describes a different course for population, economic growth, energy and land use, and the emissions that follow. We use five core scenarios and one overshoot path:
- SSP1-1.9, very low. Emissions fall steeply to net zero around mid-century.
- SSP1-2.6, low. Net zero carbon dioxide shortly after mid-century.
- SSP2-4.5, intermediate. Emissions stay near today’s level until mid-century, then decline.
- SSP3-7.0, high. Emissions roughly double by 2100 in a fragmented world.
- SSP5-8.5, very high. Fossil-fuelled growth with emissions tripling.
- SSP5-3.4 overshoot. High emissions until 2040, then a rapid reversal.
All temperatures here are global surface averages relative to 1850–1900, the reference period the IPCC uses for “pre-industrial”. Where we talk about a threshold being passed, we mean the 20-year average, not a single hot year. A “very likely” range covers 90% of the simulated outcomes.
Results
The century ahead
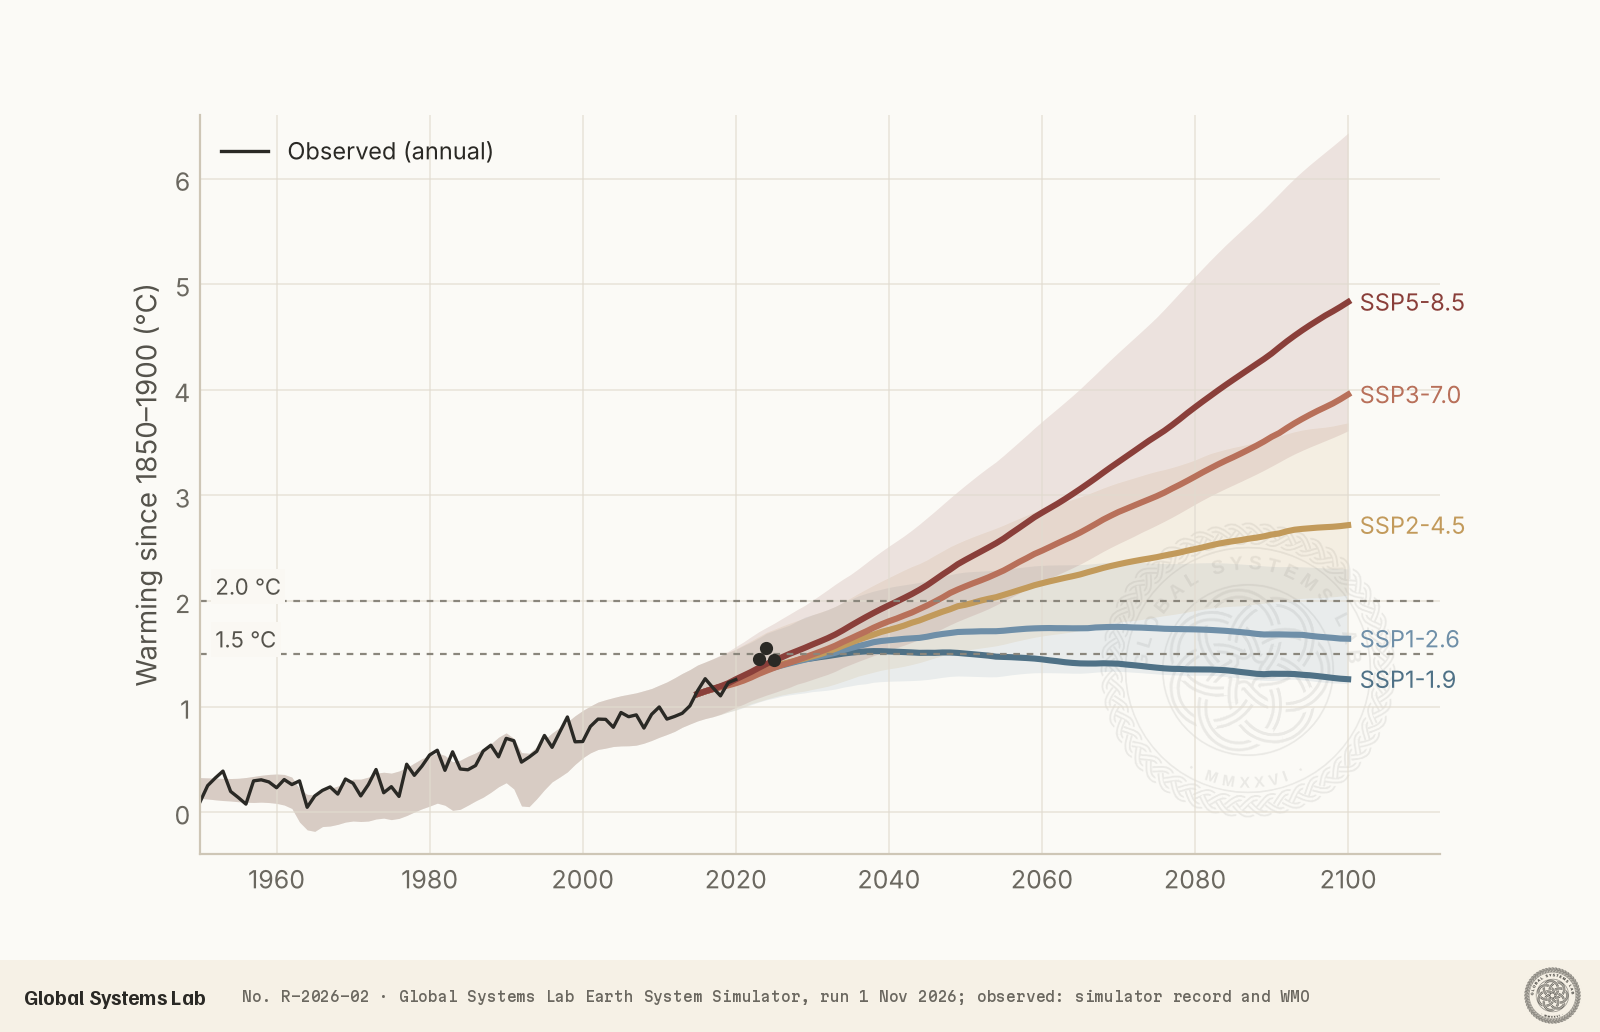
The opening figure shows the result in one picture. Up to the present the scenarios are indistinguishable: the warming already locked in and the emissions of the next decade are similar in all of them. They begin to separate in the 2030s and diverge sharply after 2050. By 2100 the median paths range from about 1.3 °C to 4.8 °C.
The two lowest scenarios level off. Under the very low path, warming peaks at about 1.5 °C in the late 2030s and then falls slowly as carbon dioxide is drawn down; by 2300 it is back below 1 °C. Under the low path the peak comes later, near 1.75 °C around 2070, and declines only gently. The other three keep climbing through 2100. In the intermediate scenario warming is still rising at the century’s end; in the high and very high scenarios it is accelerating.
End of the century, checked against the IPCC
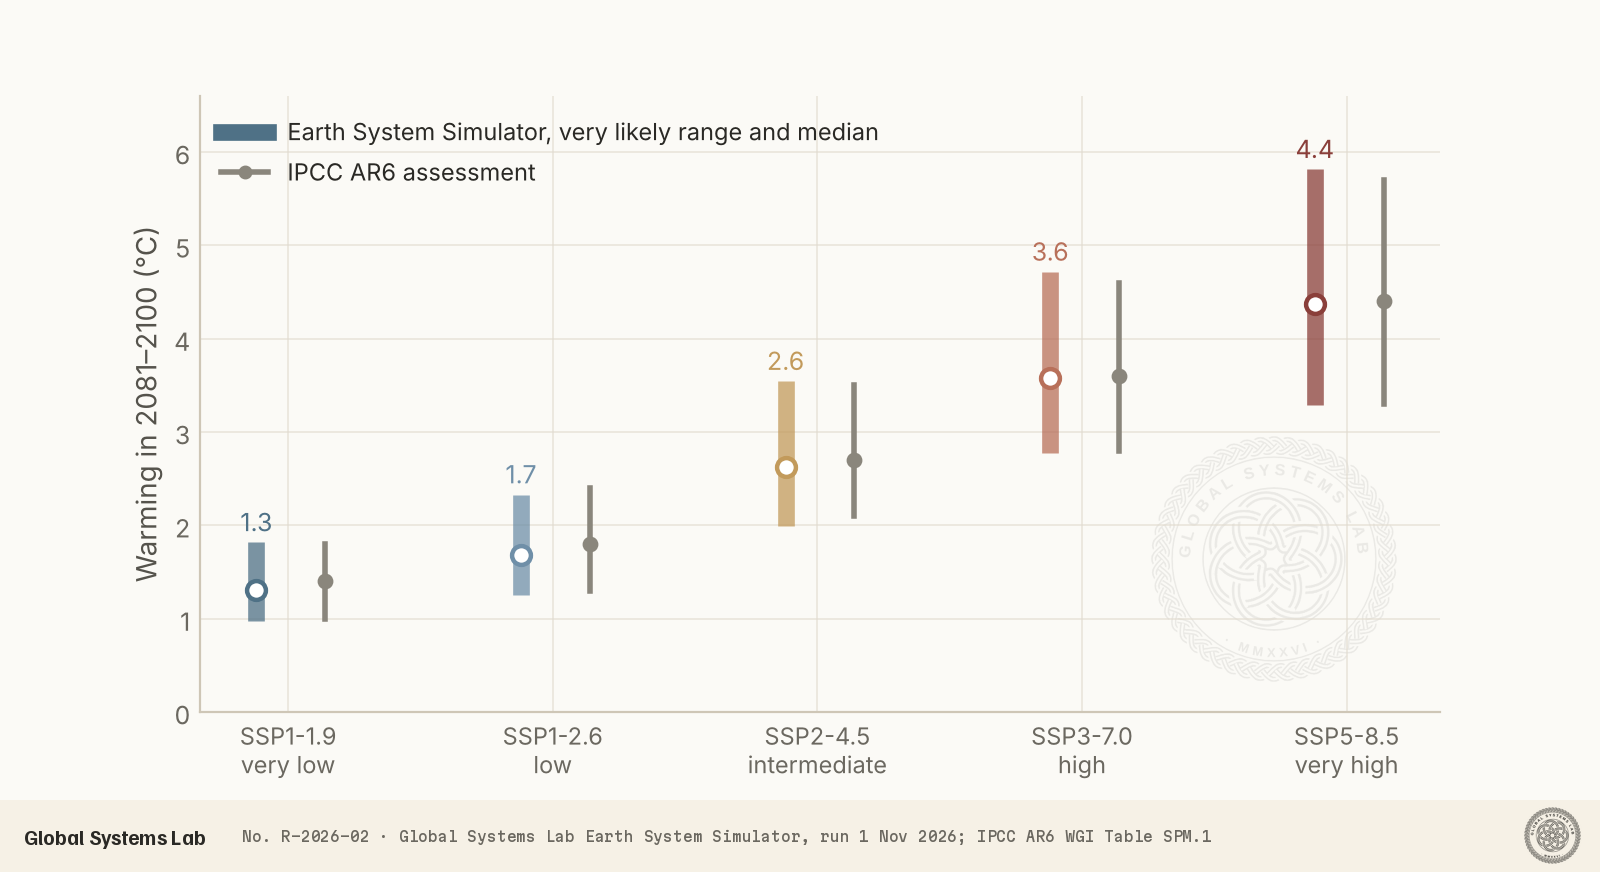
Before trusting the projections we checked them against the IPCC’s own assessment, which combined complex models, observations and theory. For every scenario the simulator’s median for 2081–2100 falls within 0.1 °C of the IPCC’s best estimate, and the ranges overlap closely.
| Scenario | Simulator, 2081–2100 | IPCC AR6, 2081–2100 |
|---|---|---|
| SSP1-1.9 very low | 1.3 °C (1.0–1.8) | 1.4 °C (1.0–1.8) |
| SSP1-2.6 low | 1.7 °C (1.3–2.3) | 1.8 °C (1.3–2.4) |
| SSP2-4.5 intermediate | 2.6 °C (2.0–3.5) | 2.7 °C (2.1–3.5) |
| SSP3-7.0 high | 3.6 °C (2.8–4.7) | 3.6 °C (2.8–4.6) |
| SSP5-8.5 very high | 4.4 °C (3.3–5.8) | 4.4 °C (3.3–5.7) |
The gap between the lowest and highest medians, about 3 °C, is the clearest single message of this report. It is larger than the uncertainty within any one scenario. How warm the world becomes is mostly a question of what we emit.
When the thresholds are passed
The 1.5 °C threshold arrives soon in almost every future. In five of the six scenarios the 20-year average passes it between 2028 and 2033; the order is set mainly by how quickly air pollution is cleaned up, since cleaner air removes a cooling haze, and by near-term methane. Only the very low scenario holds off until about 2039, and there the excess is small and temporary.
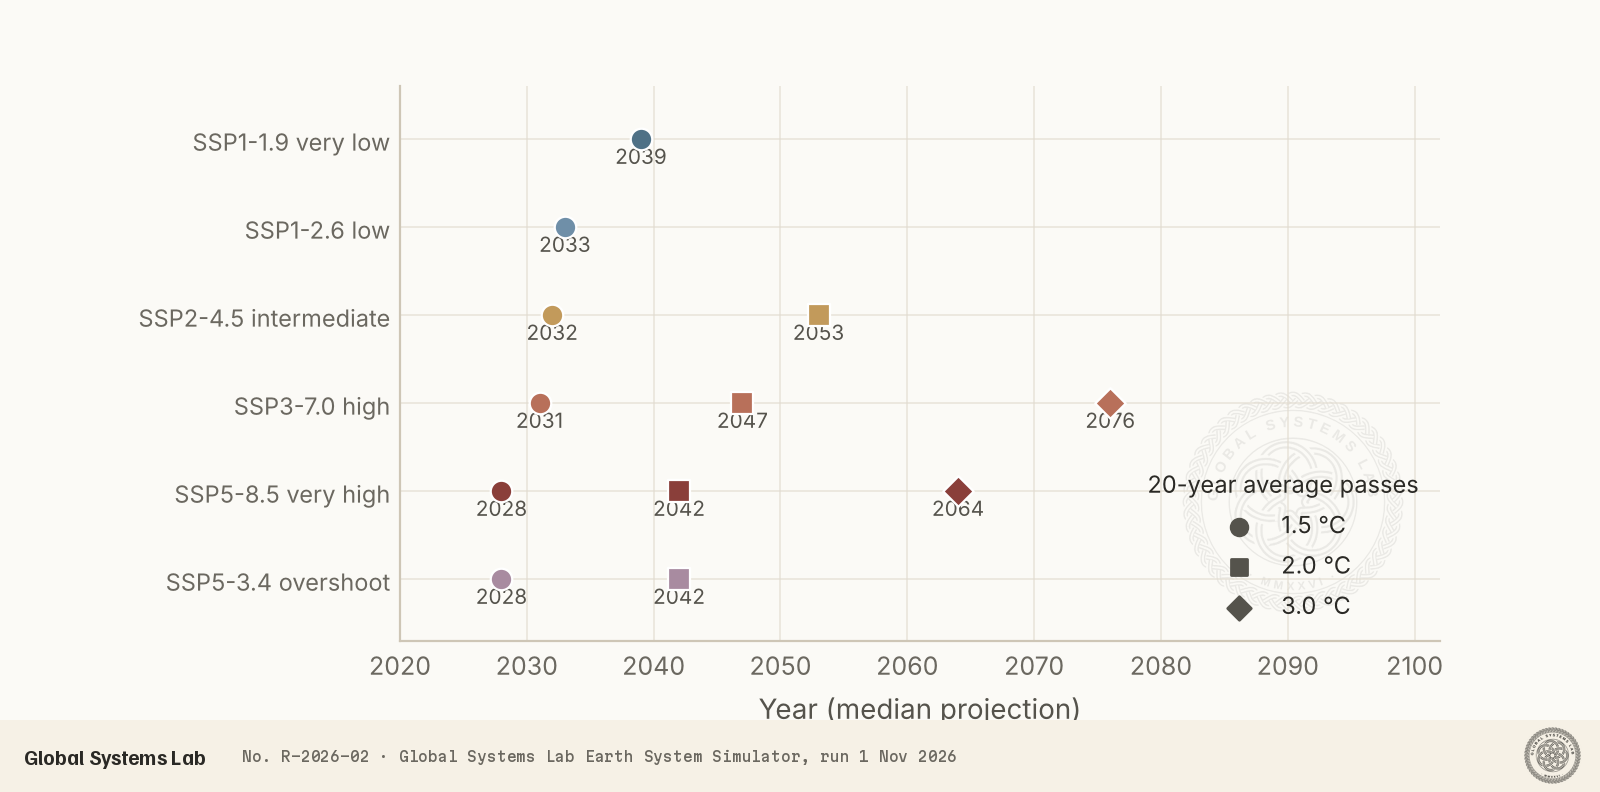
The 2 °C threshold is where the scenarios truly part ways. Under the very high path it is passed around 2042, under the high path around 2047, and under the intermediate path around 2053. The low and very low paths stay below it in the median, although the low scenario still carries roughly a one-in-six chance of exceeding 2 °C by 2100. The overshoot scenario passes 2 °C in the early 2040s, peaks near 2.4 °C around 2060 and then declines, ending the century close to 2 °C. Three degrees, a level with far-reaching consequences for ice sheets, ecosystems and food production, is reached in the 2060s under very high emissions and in the 2070s under high emissions.
These timings are consistent with independent estimates. The latest annual update of the Indicators of Global Climate Change, published in June 2026, put human-induced warming at about 1.37 °C in 2025, rising at roughly a quarter of a degree per decade, and found the remaining carbon budget for 1.5 °C small enough to be used up in about three years at current emissions.
What drives the warming
The simulator can separate the warming into its causes. The figure below does that for the intermediate scenario, today and in 2100.
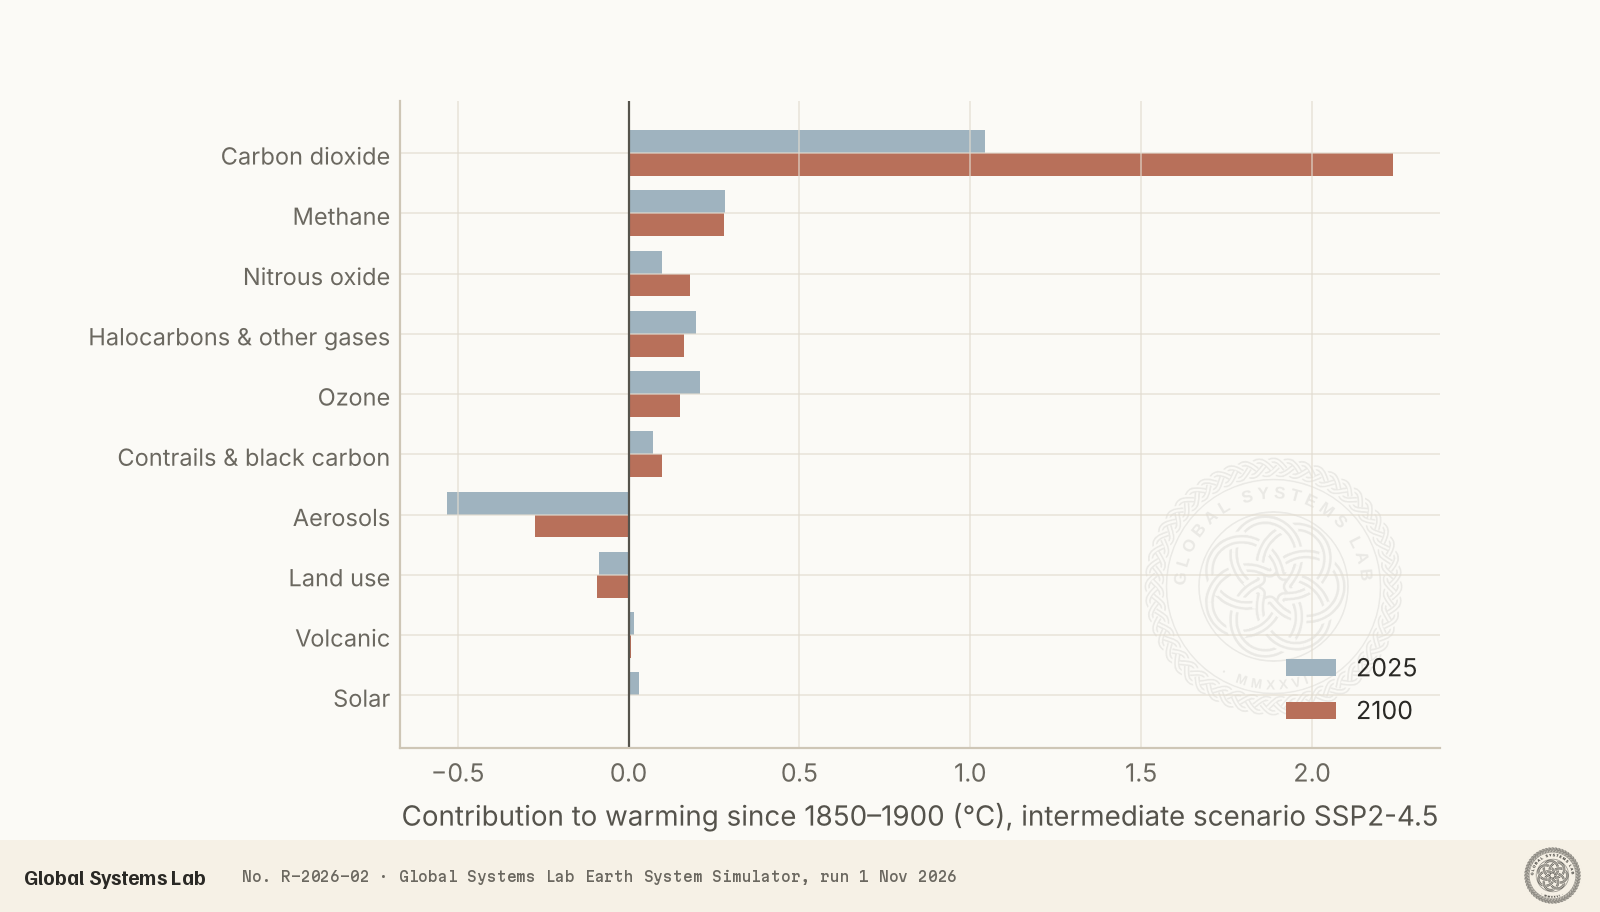
Carbon dioxide is already responsible for about 1.0 °C of warming and grows to about 2.2 °C by 2100, because it accumulates and lingers for centuries. Methane adds roughly 0.3 °C, and nitrous oxide, industrial gases and ozone smaller amounts. The main cooling influence is aerosols: tiny particles from burning fuels, which reflect sunlight and brighten clouds. They currently offset about half a degree. As countries clean their air, that offset roughly halves by 2100, which is good for health but adds to the warming. Changes in land use cause a little cooling, mostly by making the land surface brighter. Volcanoes and the Sun play only minor, short-lived roles.
The same split shows why the scenarios diverge. In 2100, carbon dioxide alone contributes about 1.4 °C under the low scenario and about 4.0 °C under the very high one. Net-zero carbon dioxide is what stops the climb.
How much depends on the climate’s sensitivity
Even with emissions fixed, the outcome is uncertain, because we do not know exactly how strongly the climate responds to carbon dioxide. The usual measure is the warming from a doubling of carbon dioxide once the climate settles. The IPCC’s best estimate is 3 °C, very likely between 2 °C and 5 °C. The simulator’s ensemble, constrained by the observed record, spans a similar range.
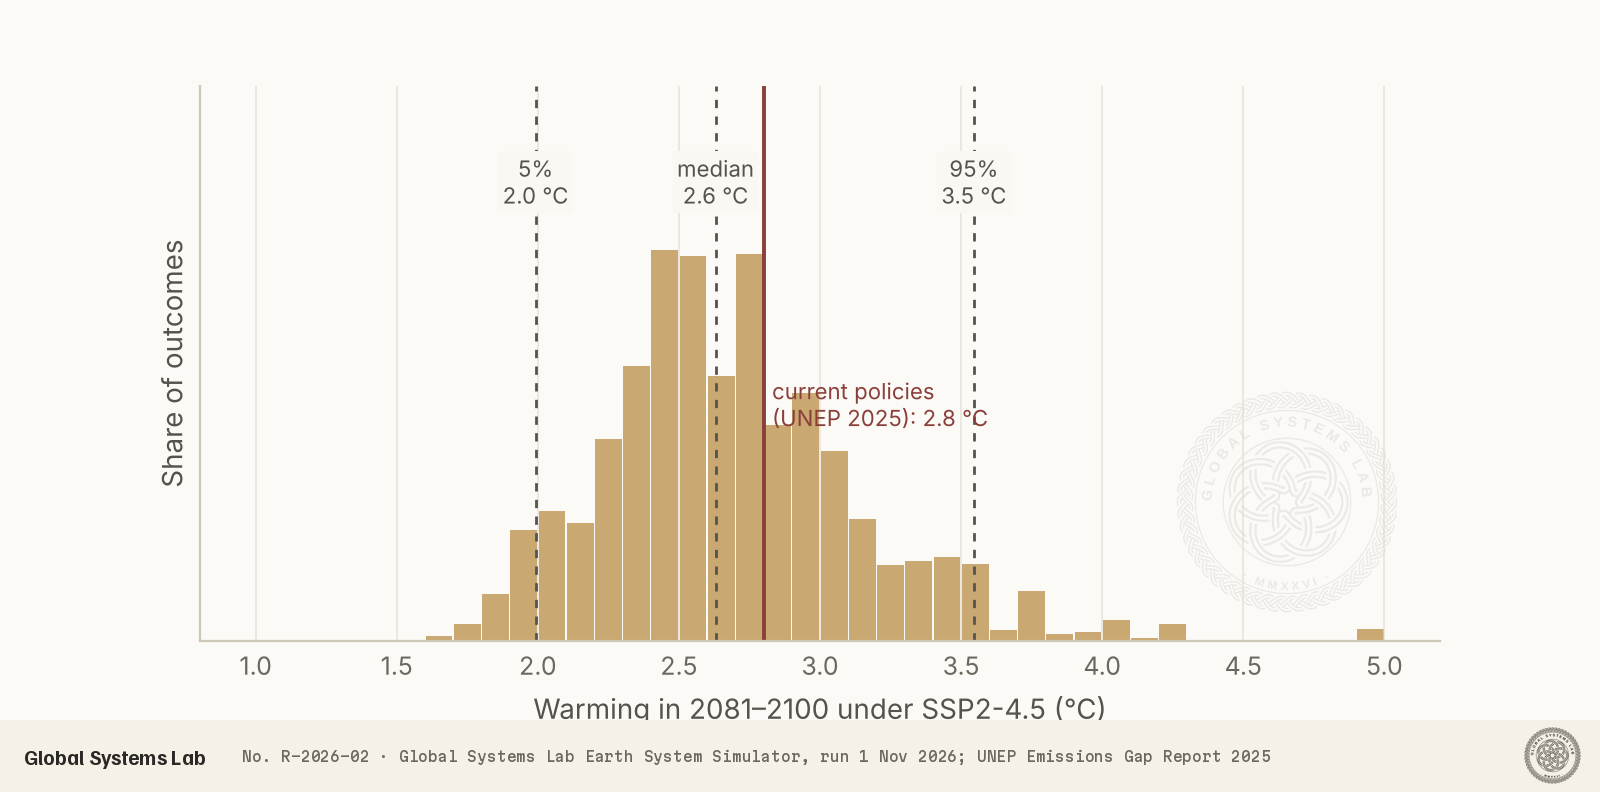
For the intermediate scenario, that uncertainty spreads end-of-century warming from about 2.0 °C to 3.5 °C, with a median of 2.6 °C. A low-sensitivity climate would give about 2.1 °C by 2100; a high-sensitivity one about 3.8 °C. The distribution has a longer tail on the warm side: outcomes well above the median are more likely than outcomes well below it. That tail is a reason to treat the higher end seriously rather than planning only for the middle.
The United Nations Environment Programme’s Emissions Gap Report 2025 estimated that policies in place today lead to about 2.8 °C this century, and full delivery of countries’ pledges to about 2.3–2.5 °C. Both figures sit inside this distribution, close to the intermediate scenario. That is the closest of the five to the world as it is currently heading.
The longer view
The year 2100 is not an end point. Under the intermediate scenario, warming continues to about 3.1 °C by 2300. Under the high and very high scenarios it reaches roughly 7–8 °C, a planet unlike any human civilisation has known. Only in the low scenarios does warming stabilise or fall. Much of the heat goes into the ocean, which the simulator estimates has gained about 450 zettajoules since 1971, and the planet is still taking in about one watt of extra energy per square metre. That heat commits the world to further sea-level rise long after temperatures stop climbing.
Uncertainty and limitations
The simulator is a global model. It projects the world’s average temperature and energy budget, not regional climate, rainfall, extremes or sea level, which depend on details it does not represent. It also does not include abrupt changes such as the collapse of ice sheets or large releases of carbon from thawing permafrost, beyond what is implicit in its calibration. Those would push results toward the warm end.
The scenarios are not forecasts. None is labelled most likely, and real emissions will not follow any one exactly. The year in which a threshold is passed is given for the median; in the warmer members of the ensemble it comes several years earlier, in the cooler members later. Natural variability, such as the current El Niño, can push individual years well above or below the trend, which is why we use 20-year averages.
Conclusions
The world is already close to 1.5 °C, and the simulator shows that threshold being crossed as a 20-year average around 2030 in almost every plausible future. What happens after that is far less settled. If emissions fall to net zero by mid-century, warming peaks below 2 °C and may decline. If they stay near today’s path, the world is heading for about 2.6 °C by the end of the century, with a real chance of 3 °C or more, and still rising. Higher-emission futures lead to 3.5–4.5 °C.
Of all the uncertainties in these projections, the largest is the one we control. The difference between the lowest and highest scenarios, about 3 °C by 2100, exceeds every uncertainty in the physics. Each tenth of a degree avoided reduces the heat, drought, flooding and sea-level rise that follow. You can run these scenarios yourself, change the climate’s sensitivity, and see the drivers for any year in the Earth System Simulator.
References
- IPCC (2021). Summary for Policymakers. In: Climate Change 2021: The Physical Science Basis. Contribution of Working Group I to the Sixth Assessment Report. Cambridge University Press. https://www.ipcc.ch/report/ar6/wg1/chapter/summary-for-policymakers/
- World Meteorological Organization (2026). State of the Global Climate 2025. WMO, Geneva. https://wmo.int/
- Forster, P. M. et al. (2026). Indicators of Global Climate Change 2025: annual update of key indicators of the state of the climate system and human influence. Earth System Science Data, 18, 3889. https://essd.copernicus.org/
- United Nations Environment Programme (2025). Emissions Gap Report 2025. UNEP, Nairobi. https://www.unep.org/resources/emissions-gap-report-2025
- Copernicus Climate Change Service (2026). Monthly climate bulletins, September 2026. https://climate.copernicus.eu/
- Riahi, K. et al. (2017). The Shared Socioeconomic Pathways and their energy, land use, and greenhouse gas emissions implications. Global Environmental Change, 42, 153–168. https://doi.org/10.1016/j.gloenvcha.2016.05.009
Data availability
The projections behind every figure are available below as a CSV file: for each scenario and each year from 1850 to 2300, the median and the 5th and 95th percentiles of global warming above 1850–1900. They come from a single run of the Earth System Simulator on 1 November 2026 with its default settings. You can reproduce and extend them in the Earth System Simulator.
Cite this
Global Systems Lab (2026). How much warmer by 2100? Five futures from the Earth System Simulator. Global Systems Lab Transmission R-2026-02. https://globalsystemslab.com/transmission/how-much-warmer-by-2100
BibTeX
@techreport{lab2026how,
  author = {Global Systems Lab},
  title = {How much warmer by 2100? Five futures from the Earth System Simulator},
  institution = {Global Systems Lab},
  number = {R-2026-02},
  year = {2026},
  month = {nov},
  url = {https://globalsystemslab.com/transmission/how-much-warmer-by-2100}
}